New scatter and bubble charts of FineReport reporting tool are published! You can check the list of plugin updates and the chart (new feature) plugin will prompt you to update to the latest version. Now let s have an overview of the new scatter chart and bubble chart.
New Scatter Chart
Scatter is a chart for plane space placement. Using space placement and color for visual and intuitionistic data ananlysis. Let s introduce scatter chart from easier to deeply.
Standard scatter chart:
![]()
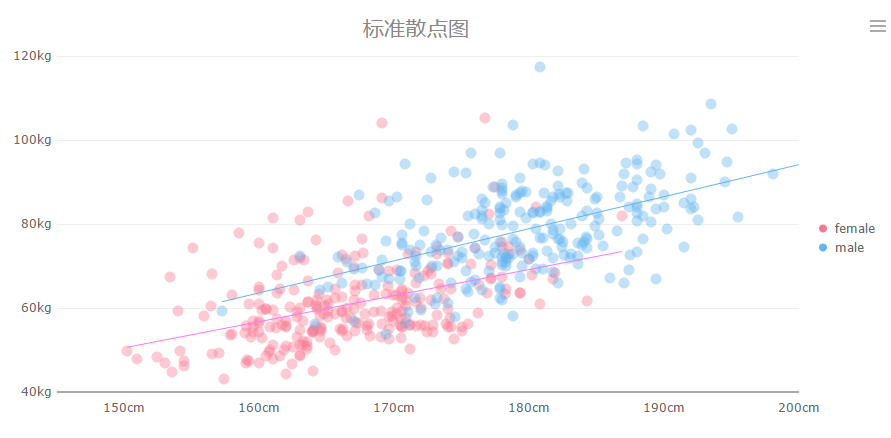
Directly from point denseness, we can see the height and weight of male is obviously higher than that of female. If we add a trend line, we can get more information.
![]()
From the chart we can see the slope of male s trend line is higher than that of the female. This means the weight height ratio of male is greater than that of the female. In other words, male are more likely to get fatter.
We know scatter can be used inbig data analysis with its space placement and color functions. In FineReport we can easily achieve the effect with the functions of gradient legend or partition legend.
![]()
![]()
Partition legend can be used in both scatter chart and bubble chart.
New Bubble chart
Bubble chart also have the function of space placement and it adds the size dimension.
Now we introduce some typical applications about bubble chart.
Standard bubble chart:
![]()
The result is also amazing on the dark background:
![]()
Partition legend can be used in bubble chart and the following hot topic popularity chart is an example.
![]()
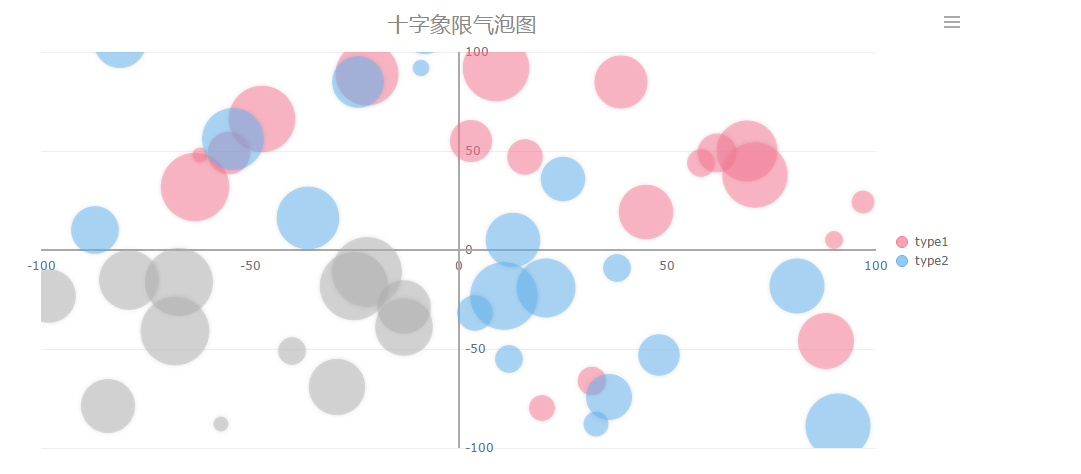
Bubble chart also have other typical application like the cross-quadrant bubble chart.
![]()
We can achieve the above functions in FineReport with only two steps.
Mechanical Bubble Chart
Finally we will introduce an original chart typeMechanical Bubble Chart.
The Mechanical Bubble Chart brings text cloud, relation-node chart, and mechanical factors together to greatly improved the effect of showing and analysis.
Install the lasted plugin to try it!
Just insert the chart type and then select data, you can creat a cool mechanical bubble chart like this.
![]()
Drag:
![]()
If you have any suggestions for the our charts, or interested in FineReport New Chart Development Plan and data visualization, please contact our chart product manager Wang Jun wangjun@finereport.com.
Next time we will release our new map chart, so stay tuned!
New Scatter Chart
Scatter is a chart for plane space placement. Using space placement and color for visual and intuitionistic data ananlysis. Let s introduce scatter chart from easier to deeply.
Standard scatter chart:
Directly from point denseness, we can see the height and weight of male is obviously higher than that of female. If we add a trend line, we can get more information.
From the chart we can see the slope of male s trend line is higher than that of the female. This means the weight height ratio of male is greater than that of the female. In other words, male are more likely to get fatter.
We know scatter can be used inbig data analysis with its space placement and color functions. In FineReport we can easily achieve the effect with the functions of gradient legend or partition legend.


Partition legend can be used in both scatter chart and bubble chart.
New Bubble chart
Bubble chart also have the function of space placement and it adds the size dimension.
Now we introduce some typical applications about bubble chart.
Standard bubble chart:

The result is also amazing on the dark background:

Partition legend can be used in bubble chart and the following hot topic popularity chart is an example.

Bubble chart also have other typical application like the cross-quadrant bubble chart.
We can achieve the above functions in FineReport with only two steps.
Mechanical Bubble Chart
Finally we will introduce an original chart typeMechanical Bubble Chart.
The Mechanical Bubble Chart brings text cloud, relation-node chart, and mechanical factors together to greatly improved the effect of showing and analysis.
Install the lasted plugin to try it!
Just insert the chart type and then select data, you can creat a cool mechanical bubble chart like this.

Drag:

If you have any suggestions for the our charts, or interested in FineReport New Chart Development Plan and data visualization, please contact our chart product manager Wang Jun wangjun@finereport.com.
Next time we will release our new map chart, so stay tuned!